NetDraw mode
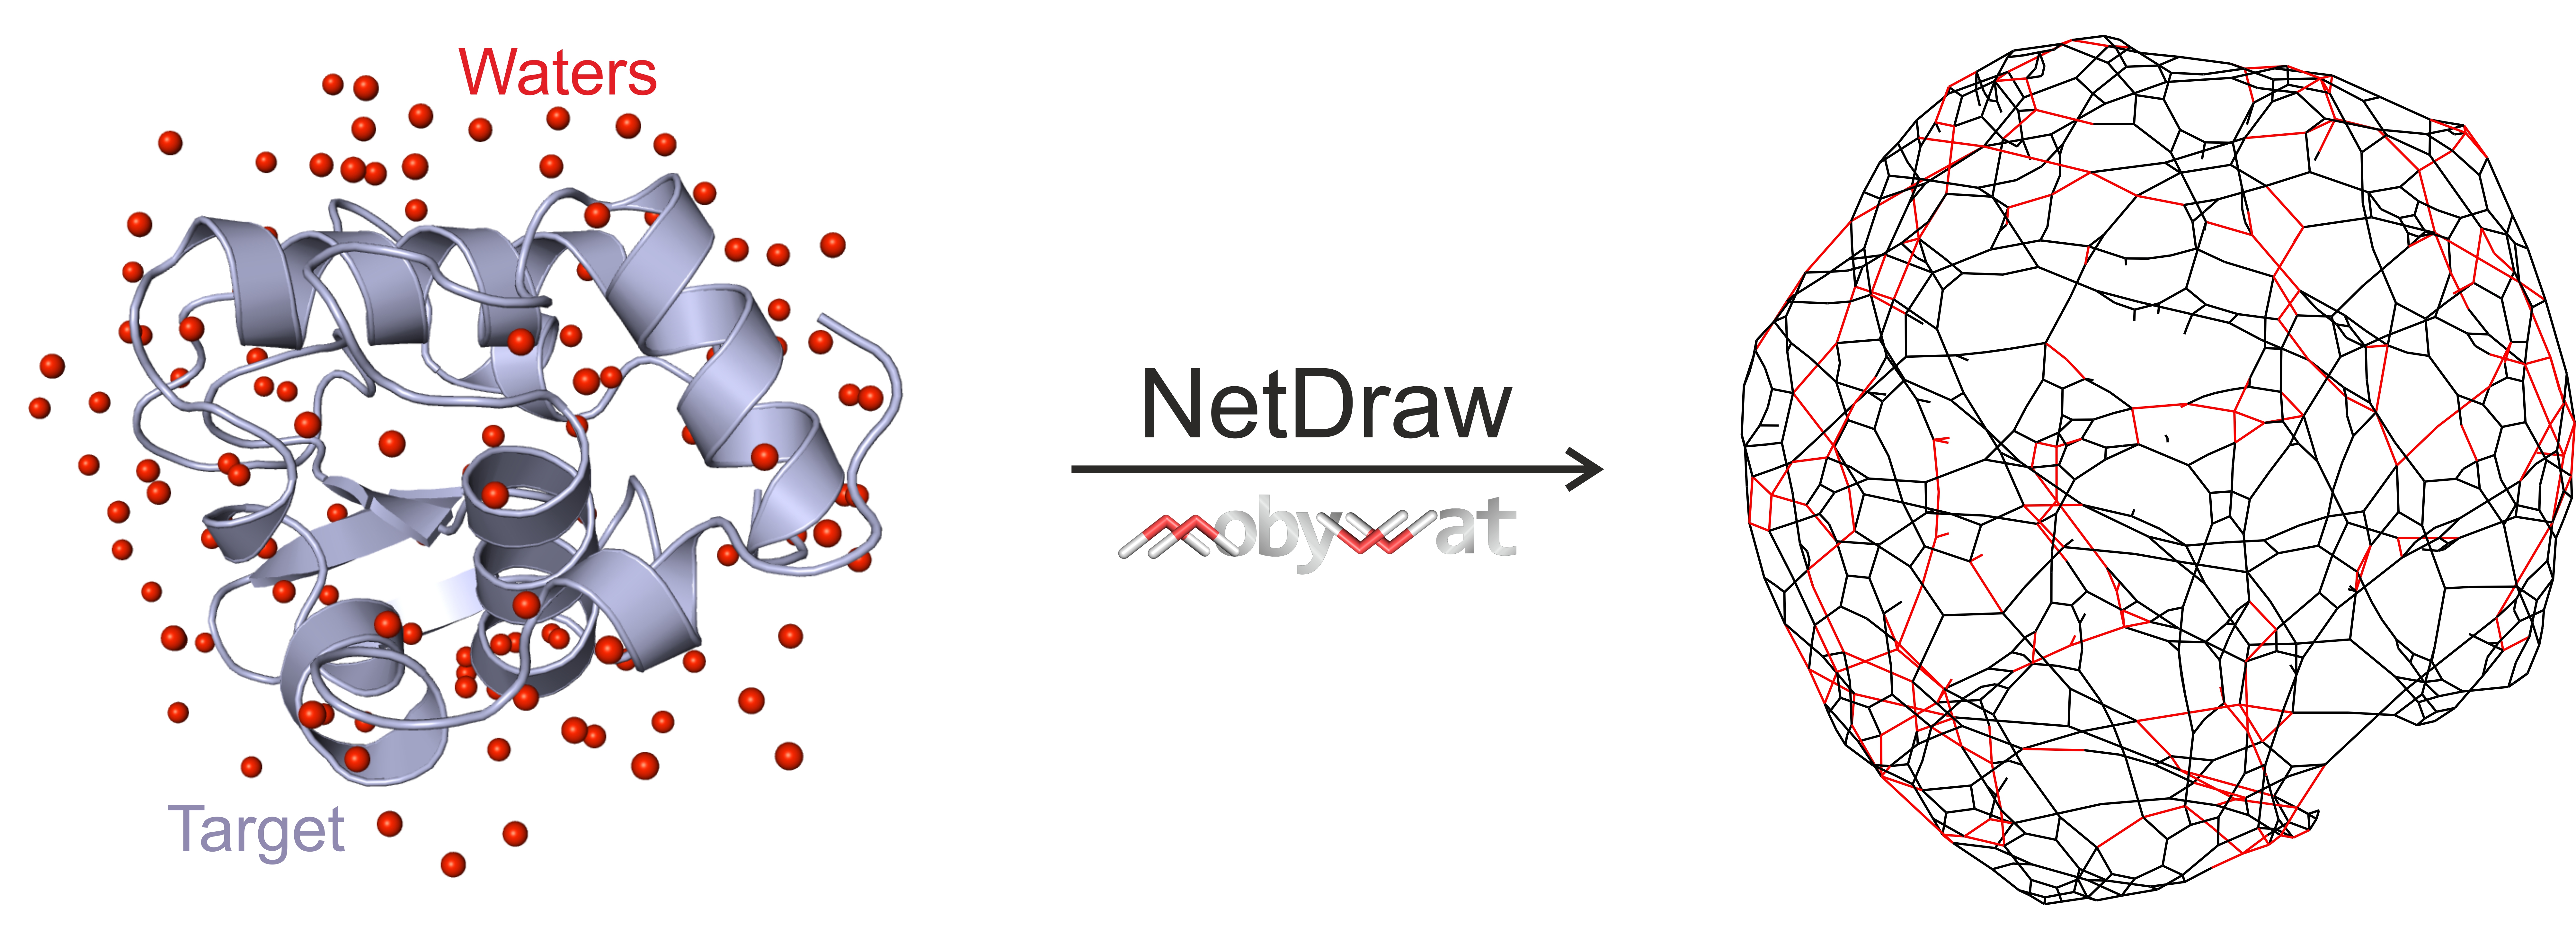
The NetDraw mode is a MobyWat tool for drawing and characterizing the hydration network of a target surface or a target-ligand interface. Using an optimized three-dimensional structure file with solute and water molecules as an input, MobyWat produces the two-dimensional hydration network graph of the surface or interface as lists of edges and nodes. Using calculated mobility information MobyWat detects static and dynamic sub-networks of the network graph which can be used for characterization of integrity of the network, prediction of complex stability (Jeszenői 2016a), etc. MobyWat also provides the graph in commonly used formats readable by network visualization and analysis programs.

In NetDraw mode, MobyWat converts three-dimensional hydration structure of an interface into a two-dimensional network graph.

Surface hydration structure and the corresponding network of system 2VB1 (hydration structure was predicted at T=368 K). Surface water oxygen atoms are shown as red spheres and hydrogen atoms are omitted for clarity. Black and red lines correspond to dynamic and static edges, respectively. Nodes are located at the connections of the edges and not shown for clarity.
A detailed User's Manual and test packages for NetDraw mode can be found on the Download page
